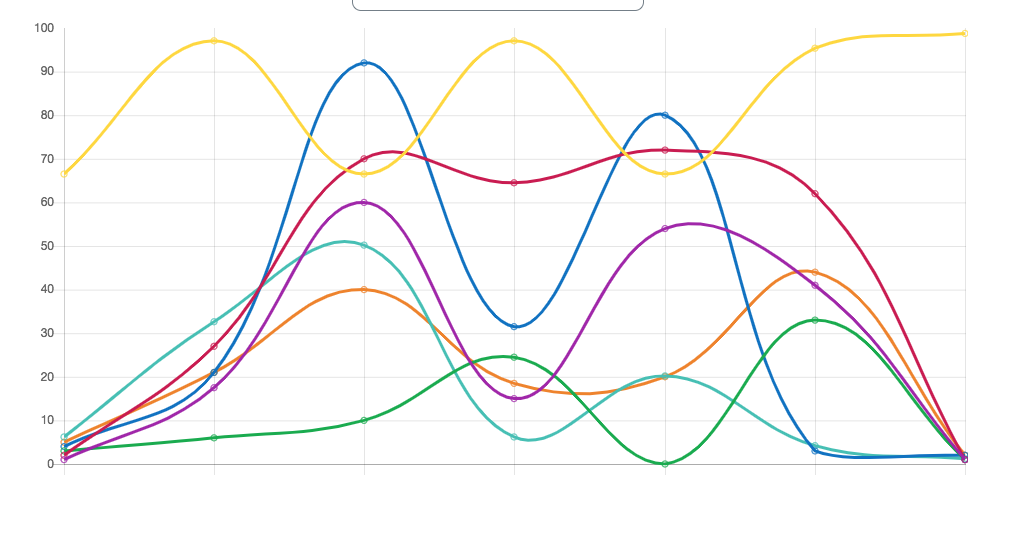
Data is the new oil, powering innovations and decisions across all sectors of society. From finance to healthcare, real-time data analytics have become a cornerstone of operational strategies, enabling organizations to make informed decisions swiftly. At the heart of this transformative wave is JavaScript, a programming language that has revolutionized the way we interact with data through dynamic charting solutions.

The Rise of JavaScript in Data Visualization
JavaScript’s journey from a simple scripting language to a powerhouse of web development is nothing short of remarkable. Its ability to manipulate HTML and CSS has made it indispensable for creating interactive and dynamic web pages. However, it’s JavaScript’s capacity for handling data visualization, particularly through charting, that has marked a significant leap forward in how we interact with and understand data.
Data visualization involves the representation of data in a visual context, such as a chart or map, to help people understand the significance of data by placing it in a visual context. JavaScript charting libraries, such as Chart.js, SciChart, Highcharts, and D3.js, have emerged as vital tools in this domain, enabling developers to create responsive, interactive, and customizable charts that can be easily integrated into web applications.
The Importance of Real-Time Data
Real-time data refers to information that is delivered immediately after collection, without noticeable delay. In today’s fast-paced world, the value of real-time data cannot be overstated. It allows businesses and organizations to respond to changes and make decisions based on the most current information. This is particularly critical in areas like stock trading, where prices fluctuate rapidly, or in emergency services, where response times can be a matter of life and death.
Integrating real-time data into JavaScript charts transforms static visualizations into dynamic dashboards that update instantaneously with new data. This not only enhances the user experience by providing up-to-the-minute information but also enables deeper insights into data trends and patterns as they unfold.
Transforming Industries with Dynamic JavaScript Charting
Several industries have been transformed by the integration of JavaScript charting with dynamic data. In the financial sector, real-time charting tools are used to track stock market trends, allowing traders to make informed decisions based on the latest market movements. Healthcare providers utilize dynamic charts to monitor patient data in real-time, leading to more timely and accurate diagnoses and treatments.
Furthermore, the retail industry leverages dynamic charting to track consumer behavior and inventory levels, enabling more efficient supply chain management and personalized marketing strategies. The sports industry, too, has embraced real-time data visualization to enhance fan engagement by providing live statistics and performance metrics during games.
Technical Advancements and Challenges
The development of real-time JavaScript charting has been supported by several technical advancements. WebSocket, a communication protocol that provides full-duplex communication channels over a single TCP connection, has been pivotal in enabling real-time data transmission between clients and servers. This has allowed for the development of highly responsive charting applications that can handle high volumes of data without significant performance degradation.
However, integrating real-time data into JavaScript charts is not without its challenges. Ensuring data accuracy and reliability in real-time systems is critical, as any delay or error in data can lead to incorrect decisions. Additionally, managing large volumes of data in real-time requires significant computational resources and efficient data processing algorithms to prevent latency and ensure smooth user experiences.
Future Prospects: Navigating the Next Wave of Innovation
As we look towards the future, the prospects for JavaScript charting with dynamic data are boundless. The increasing availability of big data and advancements in web technologies are set to push the boundaries of what’s possible, enabling more sophisticated and intricate visualizations. Machine learning algorithms integrated with real-time charting could offer predictive analytics, allowing businesses to foresee trends and make proactive decisions. Moreover, the rise of Internet of Things (IoT) devices is expected to produce a surge in real-time data, providing more opportunities for dynamic charting applications across industries.
Broader Implications for Society
The impact of real-time JavaScript charting extends beyond industry transformations; it has significant implications for society as a whole. By making data more accessible and understandable, it democratizes information, empowering individuals with the knowledge to make informed decisions. For instance, real-time environmental monitoring can enhance public awareness about climate change and pollution, encouraging more responsible behaviors. Additionally, in the public sector, dynamic charting can improve transparency and accountability by providing citizens with real-time insights into government operations and public services.
Practical Examples and Best Practices
To harness the full potential of real-time JavaScript charting, developers and organizations should consider several best practices. Firstly, selecting the right charting library that suits the project’s needs is crucial. Libraries like D3.js and SciChartoffer extensive customization options for complex projects, while Chart.js or Highcharts may be more suitable for straightforward applications.
Efficient data management is another key consideration. Developers should implement strategies to handle large volumes of data, such as data aggregation, to reduce the load on the network and improve performance. Additionally, ensuring data security, especially in applications that handle sensitive information, is paramount.
Let’s explore a few practical examples of real-time JavaScript charting in action:
- Financial Dashboard: A web application that uses SciChart to display real-time stock prices and trends, allowing investors to track market movements and make informed decisions.
- Healthcare Monitoring System: A system that utilizes Chart.js to visualize patient vitals, such as heart rate and blood pressure, in real-time, enabling healthcare providers to respond promptly to any changes in a patient’s condition.
- Environmental Monitoring Platform: An IoT-powered platform that leverages D3.js to create dynamic charts displaying real-time air quality and pollution levels across different regions, raising public awareness and guiding policy decisions.
Conclusion: Embracing the Dynamic Data Era
The revolution in JavaScript charting with dynamic data is just beginning. As technology advances, the possibilities for innovation and impact are limitless. The dynamic data era promises to transform our interaction with information, making the invisible visible and the incomprehensible understandable.
